

1. Introduction: Are We Seeing the Whole Picture?
Crime and justice debates are often dominated by headlines, fear, and political narratives. But what do the numbers really reveal? At True Report, we dive deep into statistics on crime rates, incarceration, policing, racial disparities, and reform outcomes to spotlight patterns and trends overlooked in public discourse.
2. Crime Rates: Lower Amid Public Anxiety
Contrary to popular belief that crime is spiraling, FBI data shows Index crime rates are near their lowest since the early 1960s sentencingproject.org+4ocpathink.org+4myjournalcourier.com+4.
- All major crimes—violent and property—are substantially down since the 1990s.
- Even after a pandemic bump, crime has declined or plateaued at low levels publicnewsservice.org+2prisonpolicy.org+2pew.org+2.
Yet public fear remains high, fueling a return to “tough-on-crime” reforms—from increased street patrols to stricter sentencing laws vox.com.
3. Policing: Presence Doesn’t Equal Justice
Clearance rates (cases “solved”) are often cited as performance markers. However, methodologies differ so widely that they can be misleading—and incentivize artificial inflation en.wikipedia.org.
Data from smartphone GPS shows Black and Latino neighborhoods receive significantly more police presence, even when crime rates are similar prisonpolicy.org+13arxiv.org+13worldmetrics.org+13.
In Fortaleza, Brazil, focused police blitzes reduced violent crime by 35% in targeted areas—without pushing it into neighboring zones arxiv.org. This suggests policing can be strategic—but over-policing persists in many areas.
4. Incarceration Rates & Racial Disparities
4.1 The U.S. Leads the World
- The U.S. incarcerates 541 per 100,000 people—one of the highest rates globally en.wikipedia.org.
- Accounting for just 5% of the world’s population, it locks up 20% of global prisoners .
4.2 Race and Imprisonment Rates
Every U.S. state imprisons Black residents at least twice, and often up to six times, the white rate prisonpolicy.org.
Black Americans are incarcerated at over 5× the rate of white Americans; Native Americans also face highly disproportionate rates sentencingproject.org+3en.wikipedia.org+3worldmetrics.org+3.
Crime vs Punishment Disconnect
Many states show strong drops in crime but continued rises in incarceration, underscoring policy-driven sentencing vs. actual public threat prisonpolicy.org+6ocpathink.org+6pew.org+6.
For example, Oklahoma’s crime rates fell beginning in 1996, yet incarceration continued rising after that ﹣ a classic case of “if it’s criminalized, we keep locking them up” ocpa
4. Regional Disparities: Rural, Urban, Global
4.1 Wealth & Location Divide
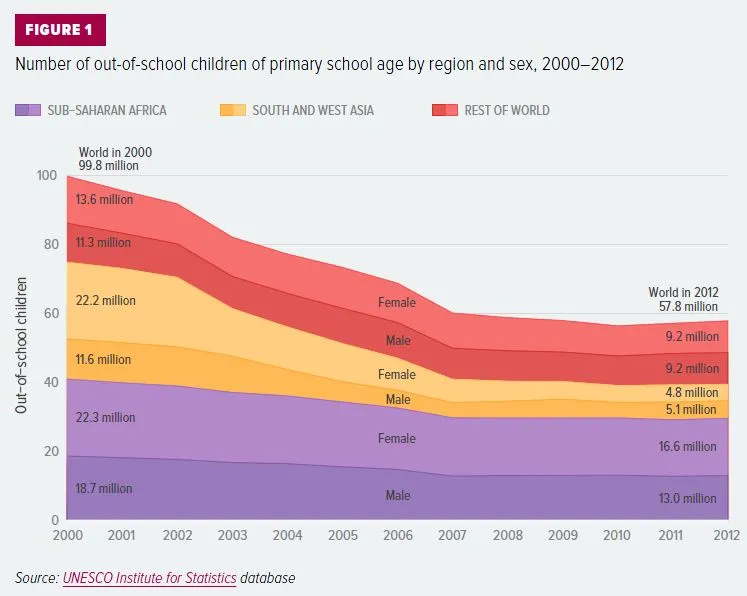
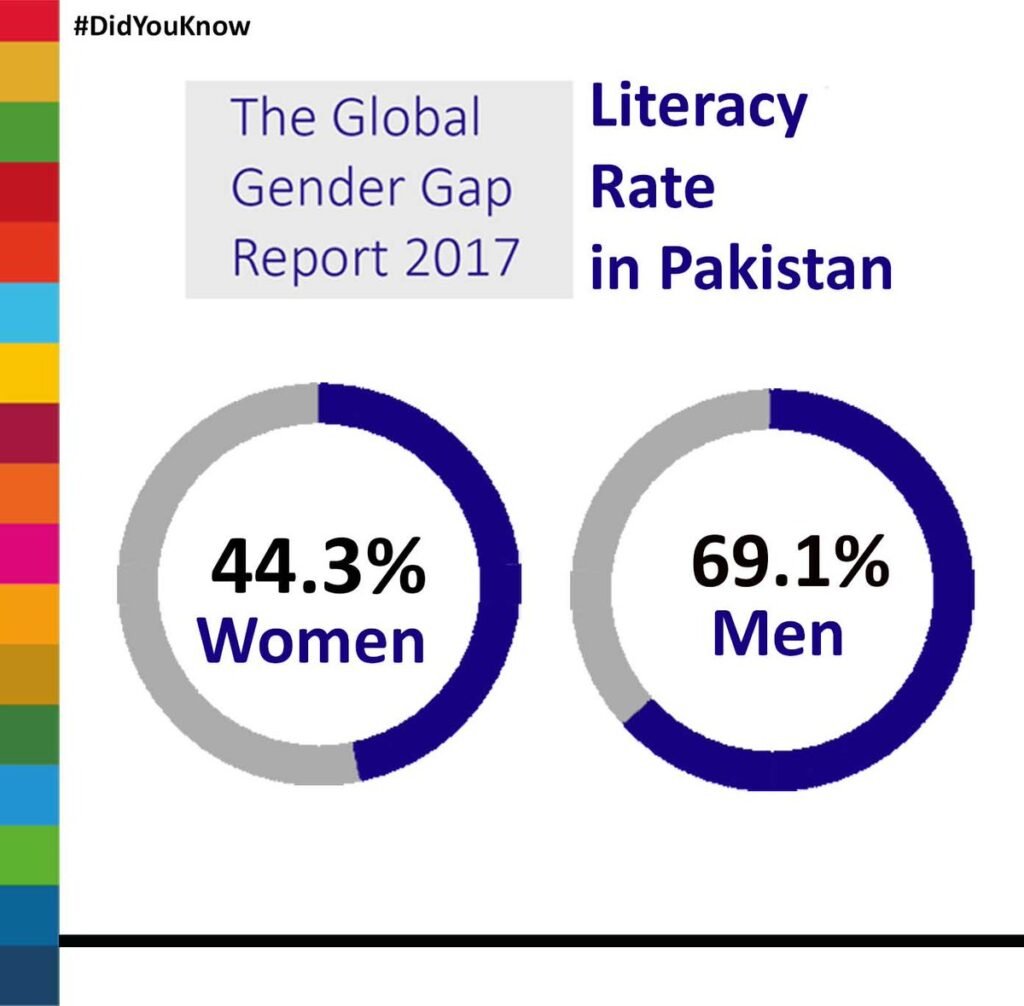
Rural U.S. districts often lag in funding, broadband access, and graduation rates . In Pakistan, only ~60% literacy overall, with female and rural enrollment significantly lower (only 22% women in labor) . UNESCO finds 251 million youth globally remain out of school—mostly in sub‑Saharan Africa and low-income countries unesco.org.
4.2 Gender & Ethnic Inequity
Pakistan: 59% of girls drop out by grade six, compared to 49% of boys blackdemographics.com+15en.wikipedia.org+15timesofindia.indiatimes.com+15. In Ghana and MENA, boys outperform girls in math and science visualcapitalist.com+5en.wikipedia.org+5en.wikipedia.org+5. In the U.S., majority–minority districts fund less and offer fewer advanced courses gitnux.org.
5. Early Gaps Widen Over Time
High‑SES kindergarteners start ahead—and stay ahead. Studies show strong correlations between socioeconomic status and literacy outcomes from kindergarten onward epi.org.
6. Advanced Learning & Opportunity Gaps
Only ~50% of Black and Hispanic students take AP/STEM classes compared to 75% of White students gitnux.org. Schools in high-poverty or minority areas have fewer extracurriculars, fewer experienced teachers, and higher dropout rates elearninginfographics.com.
7. Higher Education: Affordability & Mismatch
Philippines example: free K–12 but higher ed brings informal fees and poor job-market alignment—leading to dropouts, brain drain en.wikipedia.org. Pakistan investment remains ~1.7% of GDP vs UNESCO’s recommended 4–6% dailywaadi.com+1thenews.com.pk+1.
8. Regional Bright Spots & Reforms
U.S.
Districts like Spring Branch, TX, improved through early support programs and summer learning houstonchronicle.com.
Pakistan
Islamabad ranks highest in Pakistan on district-level education index; stark variance otherwise timesofindia.indiatimes.com+5pid.gov.pk+5axios.com+5.
Europe
Lithuania’s capital region boasts 72% tertiary attainment vs EU’s 43% average ec.europa.eu.
9. Solutions & Policy Directions
Key solutions include:
- Attendance-focused interventions: mentorship, community partnerships
- Targeted tutoring and extended learning time in low-performing areas axios.com+1apnews.com+1
- Early childhood investment to offset preschool SES gaps
- Equitable funding reforms, broadband access in rural districts
- Gender-sensitive policies in regions with stark gender disparities thenews.com.pk+2en.wikipedia.org+2dailywaadi.com+2
- Upgraded teacher training and resources in underserved zones
10. Conclusion: Are Students Really Falling Behind?
Yes—but not uniformly. Learning loss, attendance issues, and deep inequality are real crises. Despite participation, millions don’t learn to literacy standards. But targeted reforms—like the ones explored—can close gaps.
Appendix & Data Sources
- UNESCO GEM Report & COVID learning impact timesofindia.indiatimes.com+2axios.com+2timesofindia.indiatimes.com+2
- NAEP findings & Education Recovery Scorecard axios.com+1timesofindia.indiatimes.com+1
- U.S. NCES usage & attendance
- Pakistan education stats
- UNESCO out-of-school data
- SES gaps from EPI theguardian.com
- US opportunity gap & minority school funding gitnux.org
- Philippines higher education report
- Ghana/MENA issues en.wikipedia.org
- EU tertiary stats ec.europa.eu